Market, pullback or breakout? How to choose your entry.
A better entry price improves your reward-to-risk, but only if you actually get filled. The trade-off between price and probability is the whole game.
You have a setup you like. Buy now and you are certain to be in, but you might be chasing. Wait for a dip and you get a better price, but the stock may leave without you.
Most traders decide by gut feeling. Use arithmetic instead: compare the entry options on risk per share, reward per share, chance of being filled and expected value, then choose.
The problem: you only see the reward, not the fill
A limit order below the market always looks better on paper: smaller risk per share, bigger reward, better ratio. What the numbers leave out is that the order only fills some of the time.
If the stock runs away from your limit, the great ratio is worth nothing. If you always buy at market, you accept the worst ratio in exchange for certainty. Both habits are incomplete.
Key concept: price × probability
The plan’s stop and target are fixed; moving the entry changes how much you risk and gain per share. The deeper the pullback you wait for, the lower the chance it happens.
Compare entries by expected value per share, not by reward-to-risk alone. A 5.2 ratio that fills half the time is not automatically better than a 2.3 ratio that always fills.
Worked example: four entries for one META plan
- Situation: META at 611.80. Stop 595, target 650. Historic win rate for this setup: about 45%.
- Decision: which of four entries has the best expected value per share?
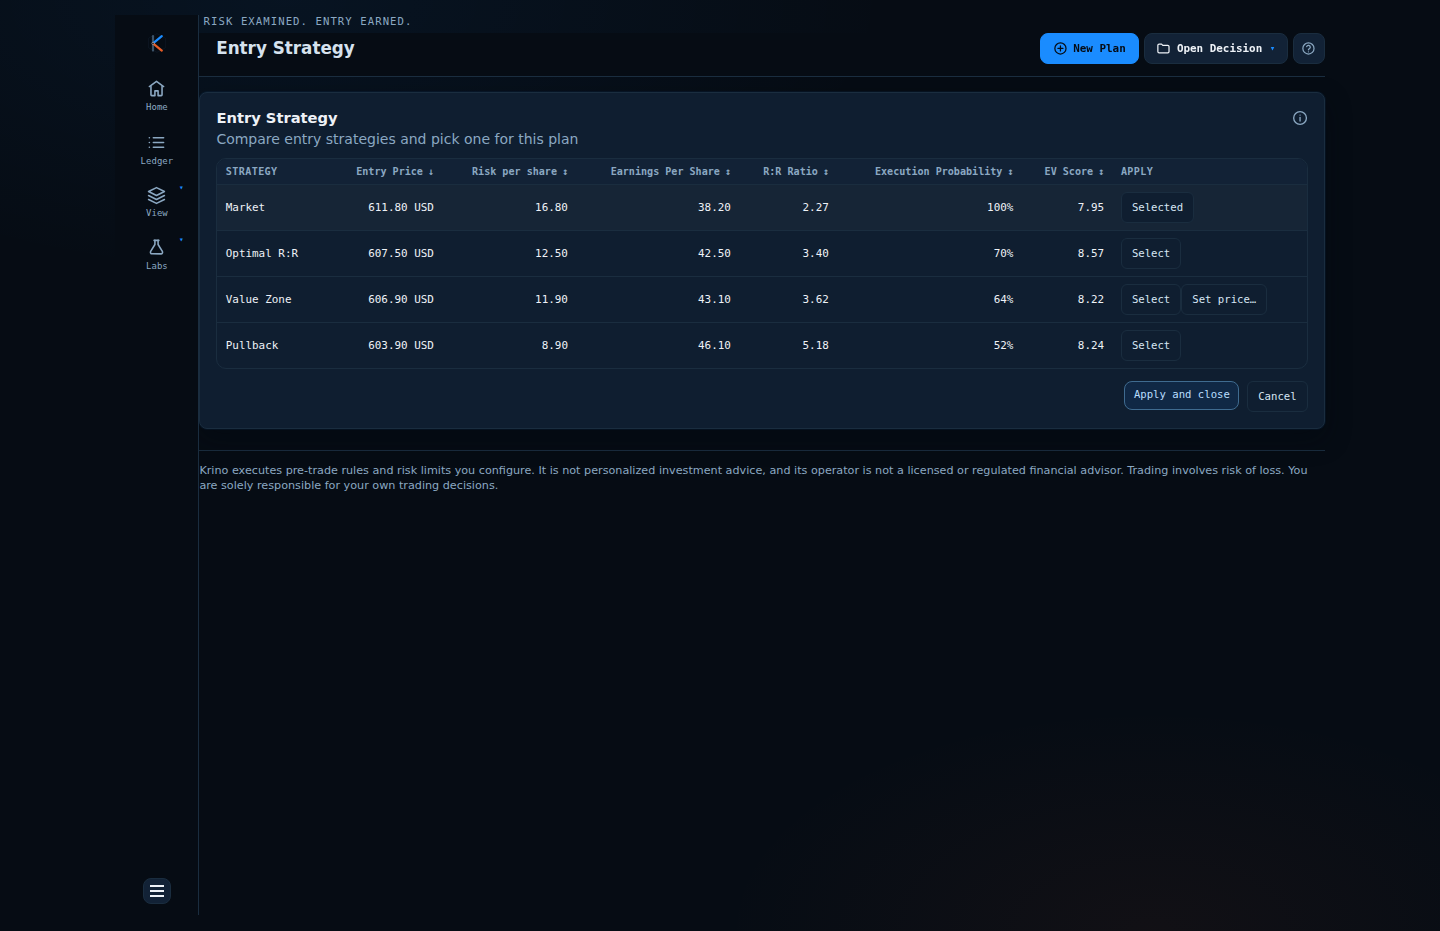
| Strategy | Entry | Risk / share | Reward / share | R:R | Fill prob. | EV score |
|---|---|---|---|---|---|---|
| Market | 611.80 | 16.80 | 38.20 | 2.27 | 100% | 7.95 |
| Optimal R:R | 607.50 | 12.50 | 42.50 | 3.40 | 70% | 8.57 |
| Value Zone | 606.90 | 11.90 | 43.10 | 3.62 | 64% | 8.22 |
| Pullback | 603.90 | 8.90 | 46.10 | 5.18 | 52% | 8.24 |
- Check the math (Market): 1.00 × (0.45 × 38.20 − 0.55 × 16.80) = 7.95.
- Check the math (Optimal R:R): 0.70 × (0.45 × 42.50 − 0.55 × 12.50) = 8.57.
- Outcome: the deepest pullback has the best ratio (5.18) but not the best expected value. The sweet spot sits in between, around 607.50.
Comparison: when each entry makes sense
| Entry | You get | You give up | Use when |
|---|---|---|---|
| Market | Certainty of a fill | The best ratio | Momentum is strong and the plan still works at today’s price |
| Pullback | Smallest risk per share | Many fills | Trend is intact and you are happy to miss it |
| Value Zone | A price near the mean (Bollinger band zone) | Some fills | Mean-reverting names, patient entries |
| Optimal R:R | The best expected value of the candidates | Simplicity | You want a data-driven limit price |
Where do breakout entries fit?
A breakout buyer pays up on purpose: price has cleared a level, and waiting for a pullback may mean never getting in. This behaves like the Market row above: a lower reward-to-risk in exchange for certainty.
The rule that keeps it honest: check that the plan still meets your minimum reward-to-risk at the price you will really pay. A breakout that works at 612 but fails at 616 is a hope, not a plan.
Common mistakes
- Chasing after the plan broke. Entering 1% above plan can push the ratio below your minimum. Decide the maximum acceptable fill in advance.
- Setting limit orders where the chart looks pretty. If the stock rarely trades there, the fill probability is tiny.
- Judging entries by R:R only. It ignores fills. Use expected value.
- Moving the entry but not the size. A lower risk per share changes the share count of a risk-based model.
A framework you can use tomorrow
- Fix stop and target from the setup, not from the entry you hope for.
- List three entries: market, a pullback, and a mid-point limit.
- For each, write risk per share, reward per share and an honest fill chance.
- Compute expected value; prefer the highest, unless it breaks your minimum reward-to-risk.
- Set an expiry on limit orders so stale orders do not fill into a changed market.
How Krino helps
Krino builds the comparison for you: market, pullback (one average true range below), value zone (from the Bollinger bands) and a search over five candidate prices for the best expected value. Fill probability falls with the distance in ATR units, and win probability comes from your own trade history, floored and capped so one lucky streak cannot dominate.
Applying a strategy updates the plan’s entry, risk and share count together, and the choice is recorded with the decision.
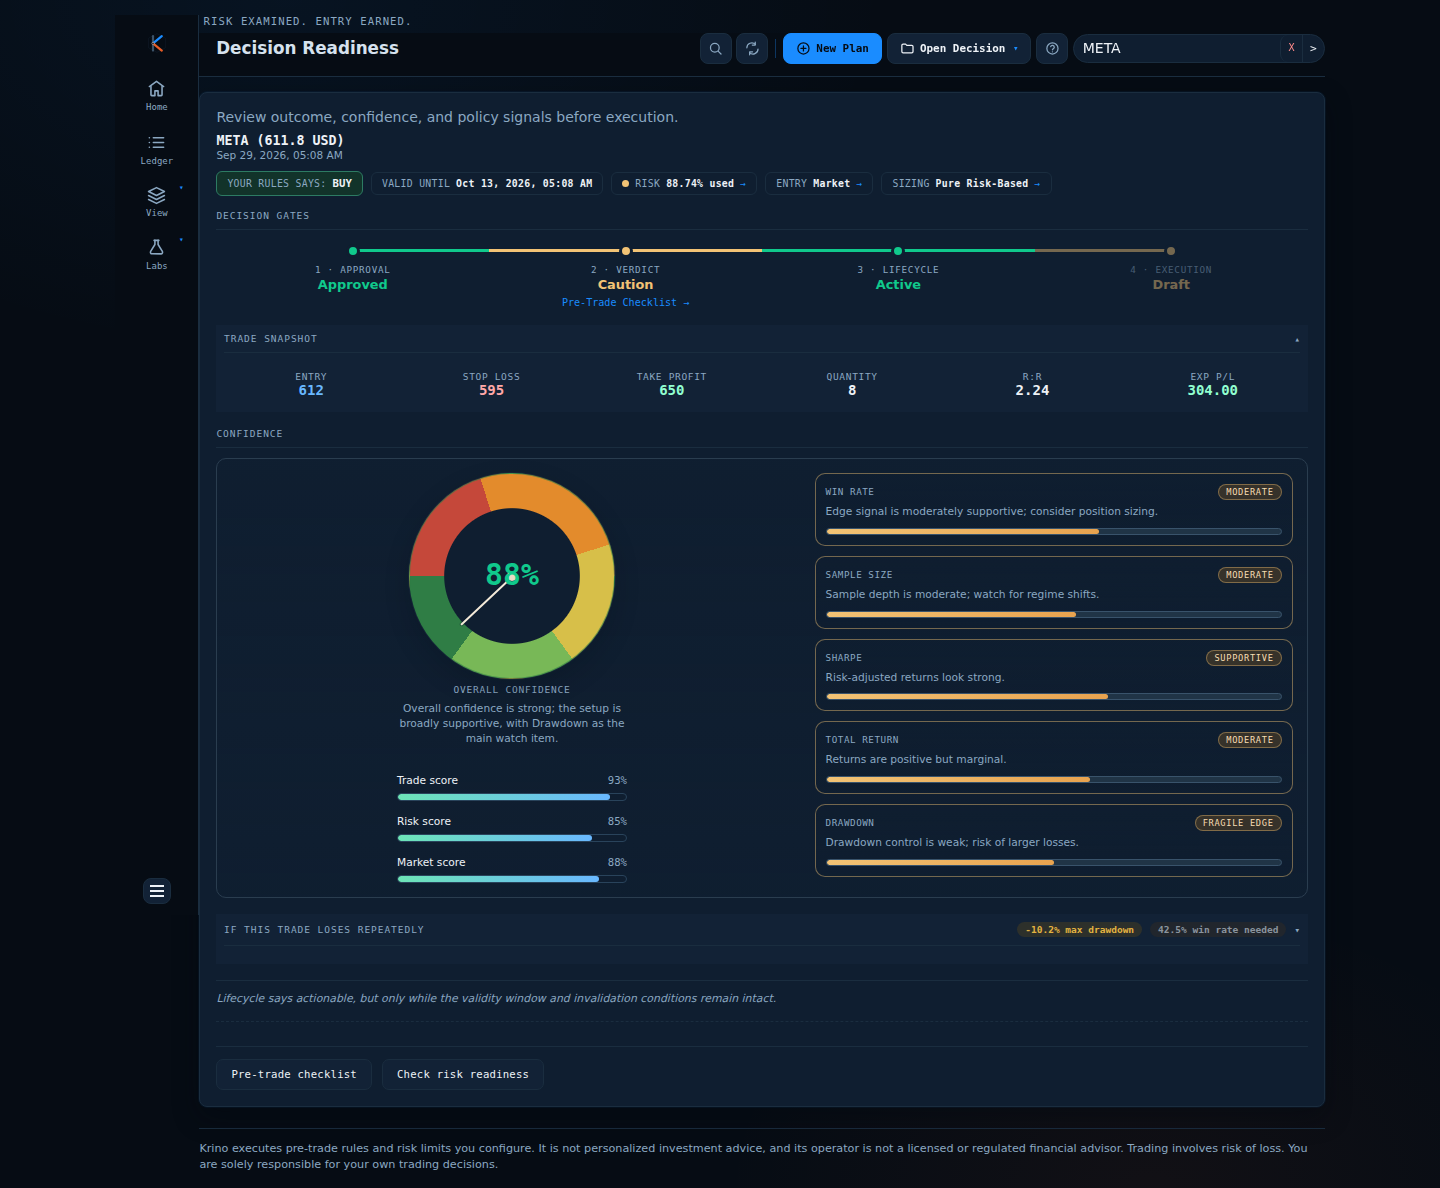
Compare the entries on a real plan.
The demo opens Entry Strategy for a META plan: entry price, execution probability and reward:risk for each entry. No signup, no email, no card.
Quick start checklist
- Decide your minimum reward-to-risk before looking at charts.
- Write down the worst fill price at which the plan still works.
- Compare at least market and one limit entry.
- Favour expected value over the prettiest ratio.
- Set an expiry on every limit order.
- Recompute size when entry changes.
The question that actually matters
Instead of asking “what is the best entry price?” ask “which entry has the best expected value that I will actually get?” On your next setup, price three entries and write the fill probability next to each one.
Choose the entry before the price chooses it for you.
Try the comparison on a sample trade. No signup needed.
Krino executes rules and risk limits you configure. It is not personalized investment advice. Trading involves risk of loss. You are solely responsible for your own trading decisions. The worked examples in this article use illustrative prices and demo data, not a recommendation or real market data.