Expected value in trading: the one number behind every good strategy.
Win rate alone is a vanity metric. A strategy that wins 40% of the time can print money, and one that wins 70% can lose it. Expected value is how you tell them apart.
Traders describe their system by its win rate. It is the easiest number to remember and the least informative. A system that wins 70% of the time but loses three times as much on each loss still loses money.
What matters is expected value: what a typical trade is worth on average, counting both winners and losers.
The problem: win rate hides the payoff
Two traders each take 100 trades. Trader A wins 70 and makes 1 unit per win, loses 30 and loses 3 units per loss: net 70 − 90 = −20. Trader B wins 40 and makes 3 units per win, loses 60 and loses 1 per loss: net 120 − 60 = +60.
Trader A feels like a winner but loses. Trader B feels like a loser but wins. Only expected value shows it.
Key concept: probability-weighted average
In R terms (R is the amount you risk), with reward-to-risk of b and win rate p:
Positive EV means the system makes money on average over many trades. It says nothing about the next one.
Never quote a win rate without the average win and the average loss next to it. The three numbers together are the strategy.
Worked example: a 12-trade backtest
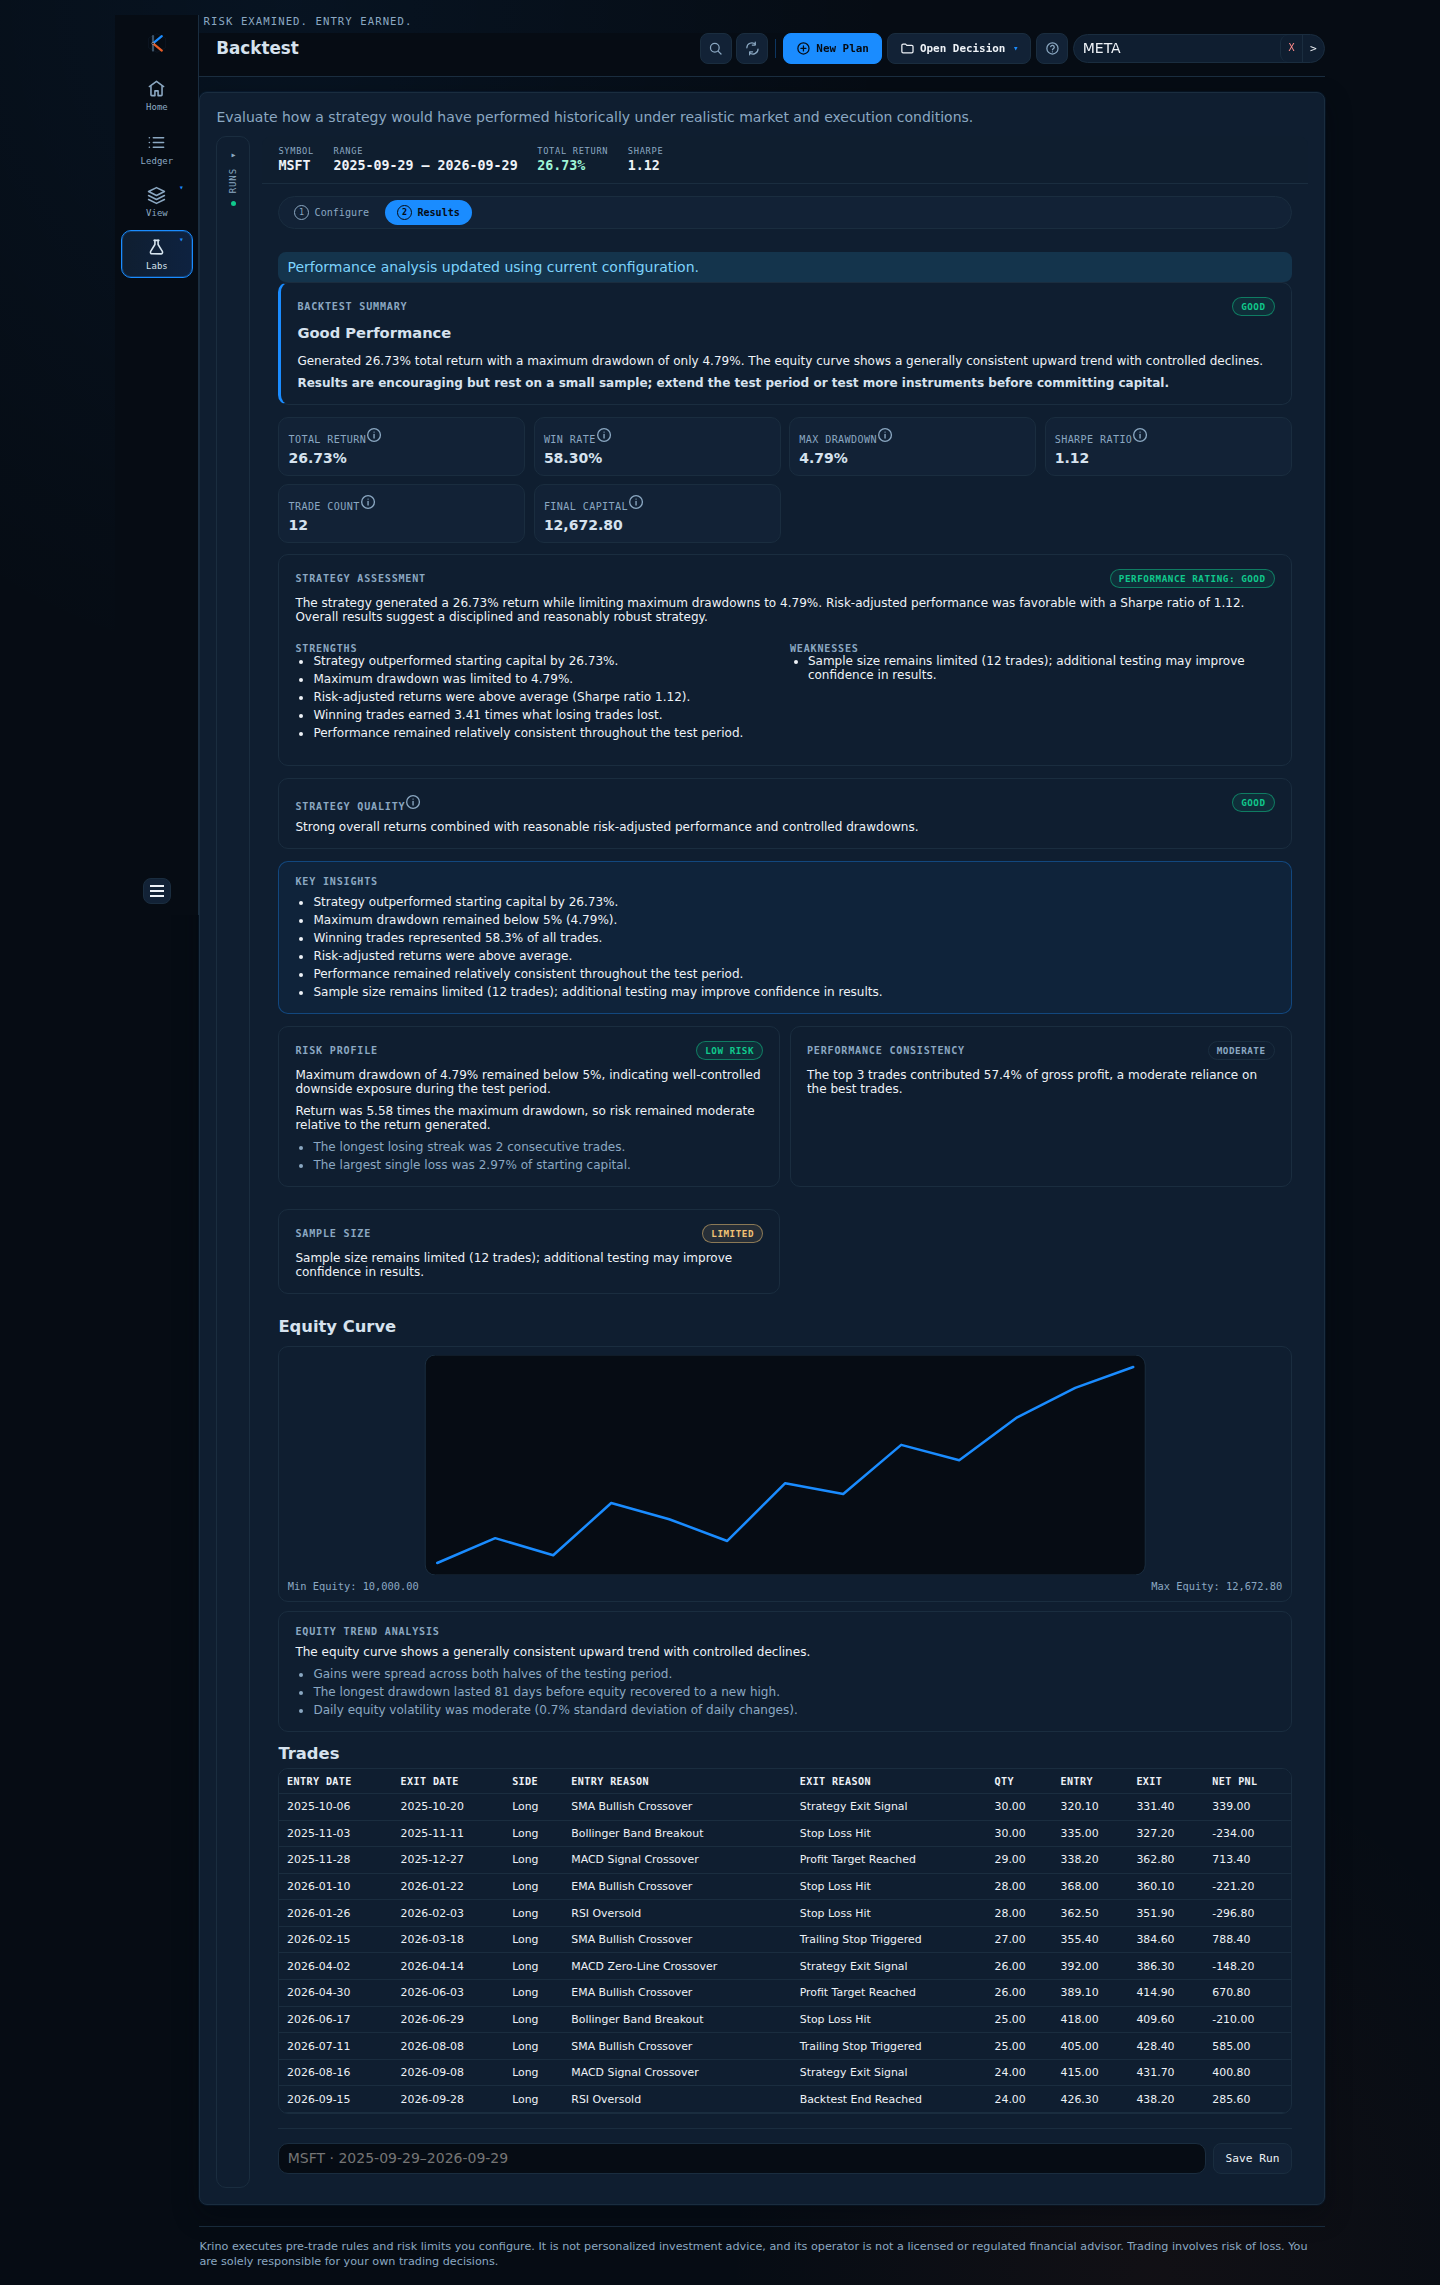
An MSFT strategy test with 10,000 starting capital produced 12 trades:
| Winners / losers | 7 / 5 (win rate 58.3%) |
| Gross wins / gross losses | 3,783.00 / 1,110.20 |
| Average win | 540.43 |
| Average loss | 222.04 |
| Payoff ratio (average win / average loss) | 2.43 |
| Profit factor (gross wins / gross losses) | 3.41 |
| EV per trade = 0.583 × 540.43 − 0.417 × 222.04 | ≈ 222.73 |
- Situation: 26.73% total return, 4.79% maximum drawdown, Sharpe 1.12.
- Decision: the EV is clearly positive, but 12 trades is a small sample. The result is encouraging, not proven.
- Outcome: extend the period or test more instruments before committing real capital, and size small until the sample grows.
Comparison: win rate vs expected value
| System | Win rate | Reward : risk | EV in R | Verdict |
|---|---|---|---|---|
| Scalper | 70% | 0.33 | −0.07 | Loses slowly |
| Trend follower | 35% | 3.0 | +0.40 | Wins, with losing streaks |
| Swing trader | 45% | 2.27 | +0.47 | Wins, steadier |
| Coin flip, 1:1 | 50% | 1.0 | 0.00 | Break-even before costs |
Check the swing row: 0.45 × 2.27 − 0.55 = +0.47R per trade. Costs (fees, slippage) come off this number.
Common mistakes
- Trusting a small sample. Twelve trades could be a system or a streak. Gather more.
- Forgetting costs. A +0.1R edge disappears under fees and slippage.
- Using in-sample numbers as a forecast. If you tuned the rules on the same data, the EV is flattered.
- Treating EV as a promise. Positive EV still has losing streaks. Size so you can survive them.
A framework you can use tomorrow
- Log every trade with the R it risked and the R it realised.
- Compute win rate, average win and average loss in R.
- Compute EV in R, then subtract an estimate of costs.
- Check the sample size. Under about 30 trades, treat results as provisional.
- Use EV to decide: which setups to take more of, which to drop, and which to size up or down.
How Krino helps
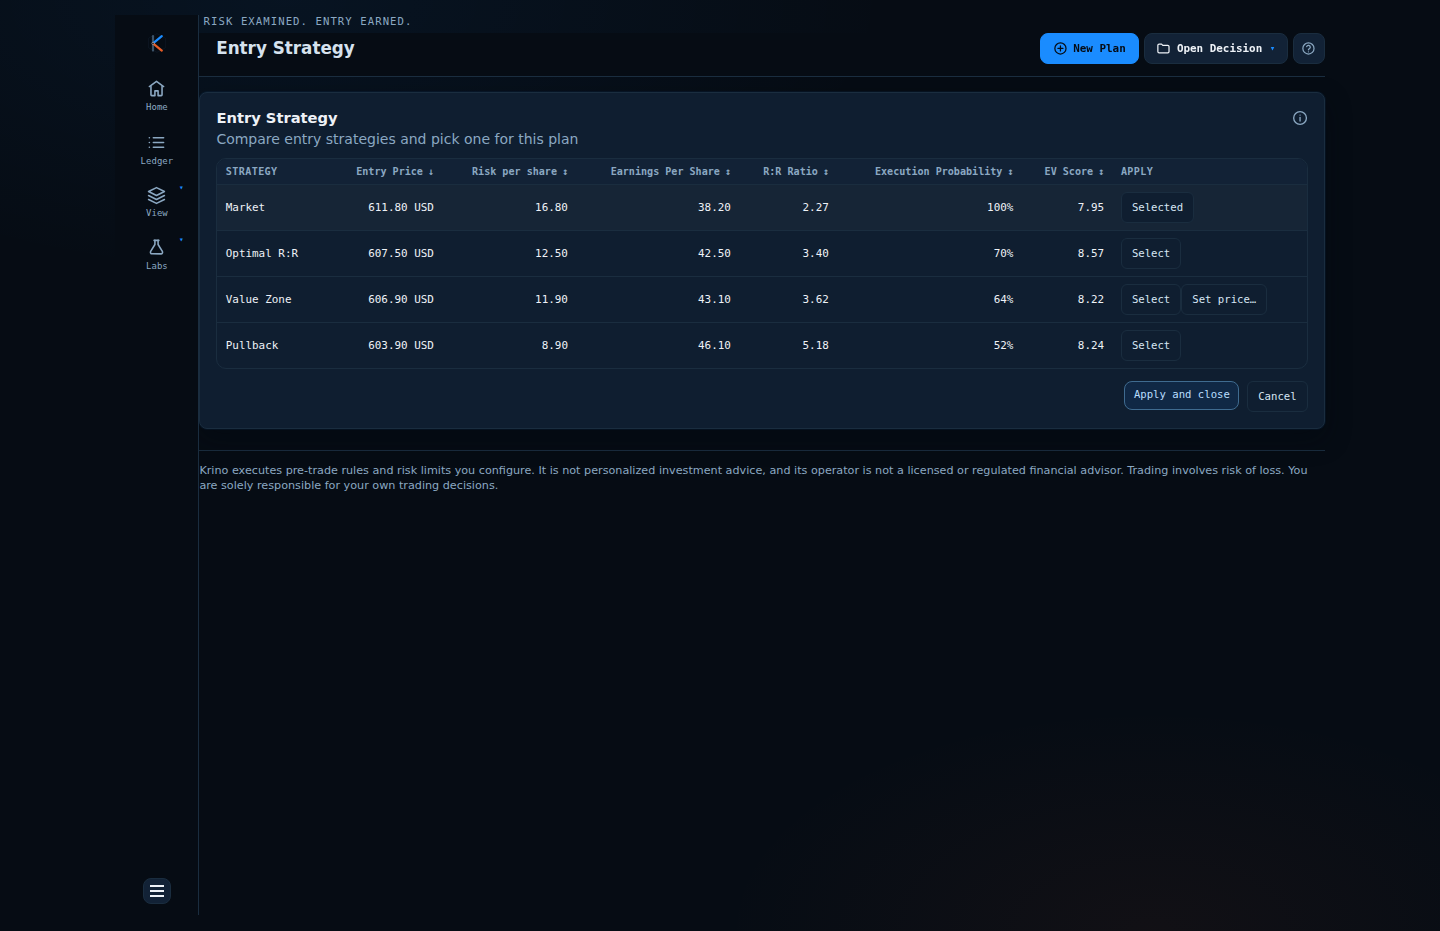
Krino uses expected value in two places. In Entry Strategy, each candidate entry is scored as fill probability × (win probability × reward − loss probability × risk), with the win probability taken from your own trade history within sensible bounds. In sizing, an EV multiplier (0.5× to 2.0×) lets size follow conviction, deliberately and visibly.
The Backtest page shows the numbers above (win rate, drawdown, Sharpe, trade list and equity curve) and flags when the sample is small.
What is one trade worth on average?
Get the numbers behind expected value.
Run a backtest in the demo and see win rate, average win and loss, drawdown and the trade list. No signup, no email, no card.
Quick start checklist
- Record risk (R) and result for every trade.
- Report win rate with average win and average loss, always.
- Compute EV in R and deduct costs.
- Treat fewer than about 30 trades as provisional.
- Let EV, not win rate, decide what to scale.
The question that actually matters
Instead of asking “how often do I win?” ask “what is a typical trade worth, after the losers?” Pull your last twenty trades tonight and compute EV in R. It settles most arguments about your system.
Know what a trade is worth before you take it.
Backtest a rule set in the demo and work out its expected value. No signup needed.
Krino executes rules and risk limits you configure. It is not personalized investment advice. Trading involves risk of loss. You are solely responsible for your own trading decisions. The worked examples in this article use illustrative prices and demo data, not a recommendation or real market data.