Risk/reward optimization: a better ratio, honestly.
A higher reward-to-risk ratio is easy to draw and hard to earn. The honest way to improve it is to change the entry, the stop and the size together, and to check what each change costs in hit rate.
Every trading book says to look for at least 2:1 reward to risk. It is good advice and easy to game: move the target further away and the ratio improves instantly, though the trade is no better.
This article covers improving the ratio in ways that hold up in the market: what the ratio buys you, what each lever costs, and how to check an improvement is real.
The problem: ratio on paper, not in the account
A trader wants 3:1, so the target goes three times the stop distance away, above any level price has recently respected. It rarely gets hit, most trades stop out or close early, and the realised ratio is nowhere near 3.
The planned ratio is only a promise. What matters is the ratio you realise times how often you realise it.
Key concept: ratio and hit rate are two halves of one number
Expectancy depends on both. The break-even win rate for a given reward-to-risk is:
| R:R 1.0 | 50.0% |
| R:R 1.5 | 40.0% |
| R:R 2.0 | 33.3% |
| R:R 2.24 | 30.9% |
| R:R 3.0 | 25.0% |
A ratio improvement is real only if your hit rate does not fall below the new break-even by more than the ratio gained. Always change one lever and look at both numbers.
Worked example: three ways to improve a META plan
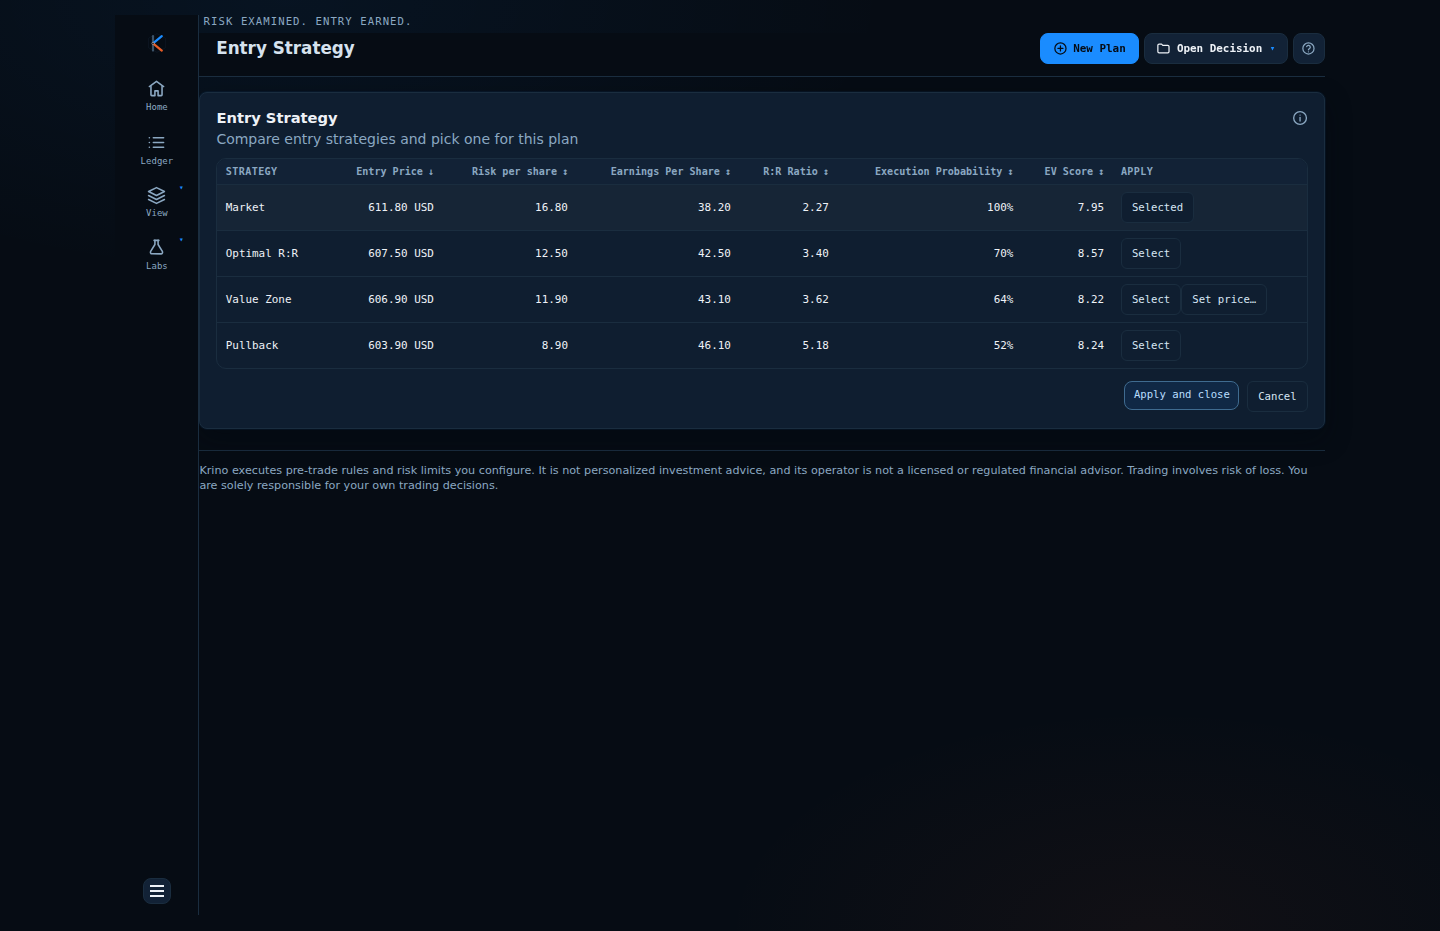
The base plan: entry 611.80 (market), stop 595, target 650. Risk 16.80, reward 38.20, ratio 2.27, assumed win rate 45%.
- Lever 1, a better entry. A limit at 607.50 cuts risk to 12.50 and lifts reward to 42.50: ratio 3.40. The cost: the order fills about 70% of the time. Expected value per share goes from 7.95 to 8.57, so it is a real improvement.
- Lever 2, a deeper pullback entry. At 603.90 the ratio is 5.18, but fill probability is 52%. Expected value is 8.24, lower than lever 1. The best ratio is not the best trade.
- Lever 3, a farther target. Moving the target from 650 to 700 lifts the ratio on the market entry from 2.27 to 5.25 (reward 88.20 against risk 16.80). Whether that helps depends entirely on how often price reaches 700. At a 25% hit rate, expected value per share is 0.25 × 88.20 − 0.75 × 16.80 = 9.45, better than 7.95. At a 15% hit rate it is 0.15 × 88.20 − 0.85 × 16.80 = −1.05, a losing trade with a beautiful ratio.
The pattern: entry improvements show both numbers (ratio and fill probability) on the same row, while target changes move the ratio you can see and the hit rate you cannot. Measure the second before you trust the first.
Comparison: levers for the ratio
| Lever | Effect on ratio | Hidden cost | How to check |
|---|---|---|---|
| Better (lower) entry | Up | Missed fills | Expected value including fill probability |
| Tighter stop | Up | More stop-outs from noise | Stop vs average true range |
| Farther target | Up | Fewer winners | Hit rate from history at that level |
| Scale out at 1R | Smooths results | Lowers average winner | Compare blended R over 20 trades |
| Lower fees and slippage | Up | None | Run costs in the simulator |
Common mistakes
- Targets set to hit a ratio. Place the target where the setup says price should stall, then compute the ratio, not the reverse.
- Stops so tight that noise takes you out. A stop inside one average true range is a coin flip.
- Ignoring costs. On small positions fees can reduce a 2.0 to 1.8.
- Judging by one trade. A ratio is validated over many trades, not one.
A framework you can use tomorrow
- Set a minimum ratio you will not trade below (for example 2.0).
- Place stop and target from the chart, not from the ratio.
- Compute the break-even win rate and compare it with your actual one.
- Compare two or three entries by expected value.
- Re-check at the price you will really pay, with costs.
How Krino helps
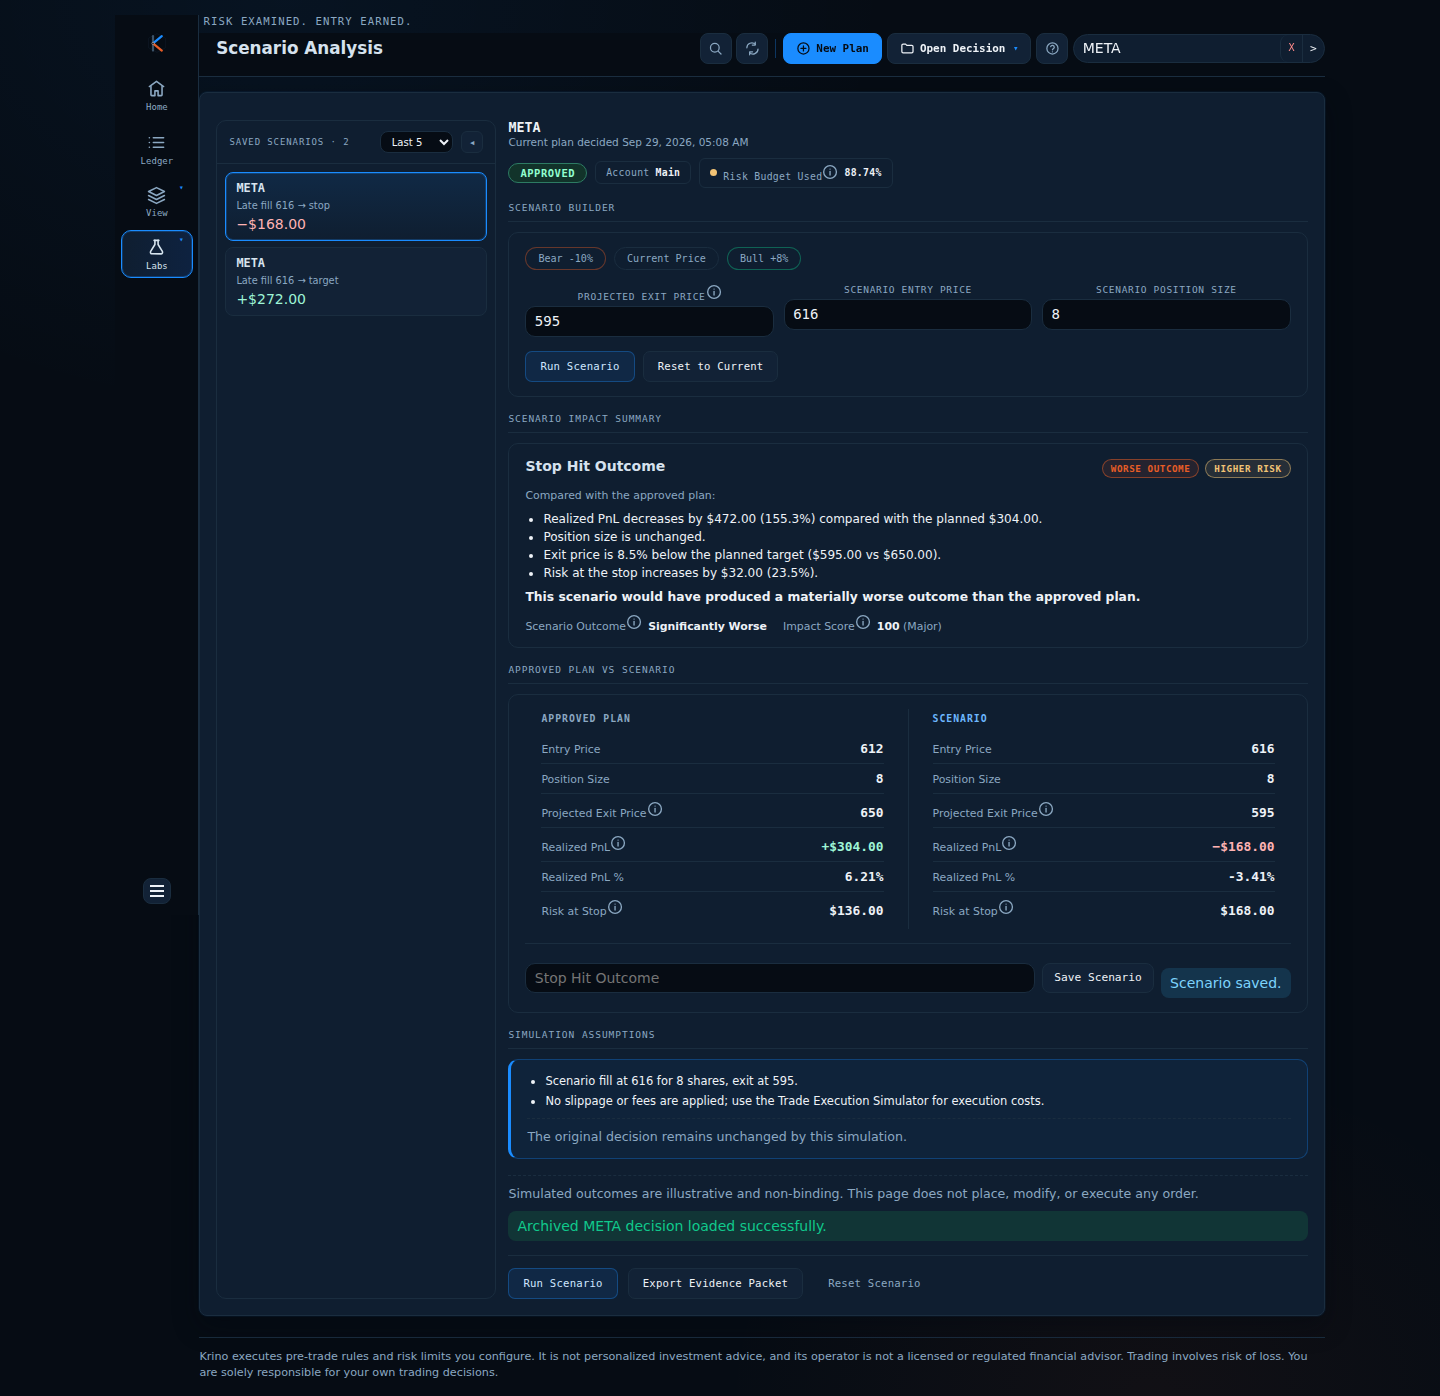
Krino lets you set a minimum reward-to-risk in your profile and checks every plan against it, so a trade that falls below the minimum is flagged before you commit. Entry Strategy puts ratio and fill probability on the same row and scores them together, and the Scenario Analysis and Execution Simulator tools show what a late fill or realistic costs do to the ratio you will actually get.
Is the ratio worth it at your hit rate?
Test the ratio, not just the chart.
The demo opens Scenario Analysis for an NVDA plan: try a different entry or exit and compare the P&L and the risk with the approved plan. No signup, no email, no card.
Quick start checklist
- Pick your minimum reward-to-risk and write it down.
- Never choose a target to reach a ratio.
- Know your break-even win rate for each ratio you trade.
- Compare entries by expected value, not ratio alone.
- Recompute the ratio at the worst acceptable fill, after costs.
The question that actually matters
Instead of asking “how do I get a higher ratio?” ask “what does this ratio cost me in hit rate?” Pick one plan, change one lever, and write down both numbers before and after.
Check your next ratio against reality.
Stress the plan in the demo before the market does. No signup needed.
Krino executes rules and risk limits you configure. It is not personalized investment advice. Trading involves risk of loss. You are solely responsible for your own trading decisions. The worked examples in this article use illustrative prices and demo data, not a recommendation or real market data.