Portfolio heatmaps: see concentration risk before it sees you.
A list of positions tells you what you own. A map tells you where you are exposed. How to read your book spatially: quality, risk, size and clusters in one picture.
You can own ten positions and still have one bet: five move together, three share a catalyst, two are too small to matter. A table of tickers and percentages won't show that. A picture will.
This article covers how to read your portfolio as a map. By “heatmap” we mean any view that encodes risk and quality by position, size and colour, so you can see concentration without calculating it.
The problem: tables hide clusters
A typical broker view is sorted by market value or by P&L. Those orderings answer “what is big?” and “what is winning?”, not “what am I over-exposed to?” or “what needs attention first?”
Traders usually discover concentration the hard way: a sector moves, everything drops together, and no single row predicted the hit.
Key concept: four variables in one view
A useful map shows the decision variables directly, so patterns are visible without arithmetic:
| Position on the chart | Quality of the setup and how much reward is left |
| Size of the marker | How much capital or risk is in it |
| Colour | What kind of trade it is (breakout, pullback, short, trend) |
| Clusters | Positions that are really the same bet |
You are not looking for pretty. You are looking for three shapes: a big bubble in a weak corner, a crowd of the same colour, and an empty quadrant you meant to fill.
Worked example: reading the map
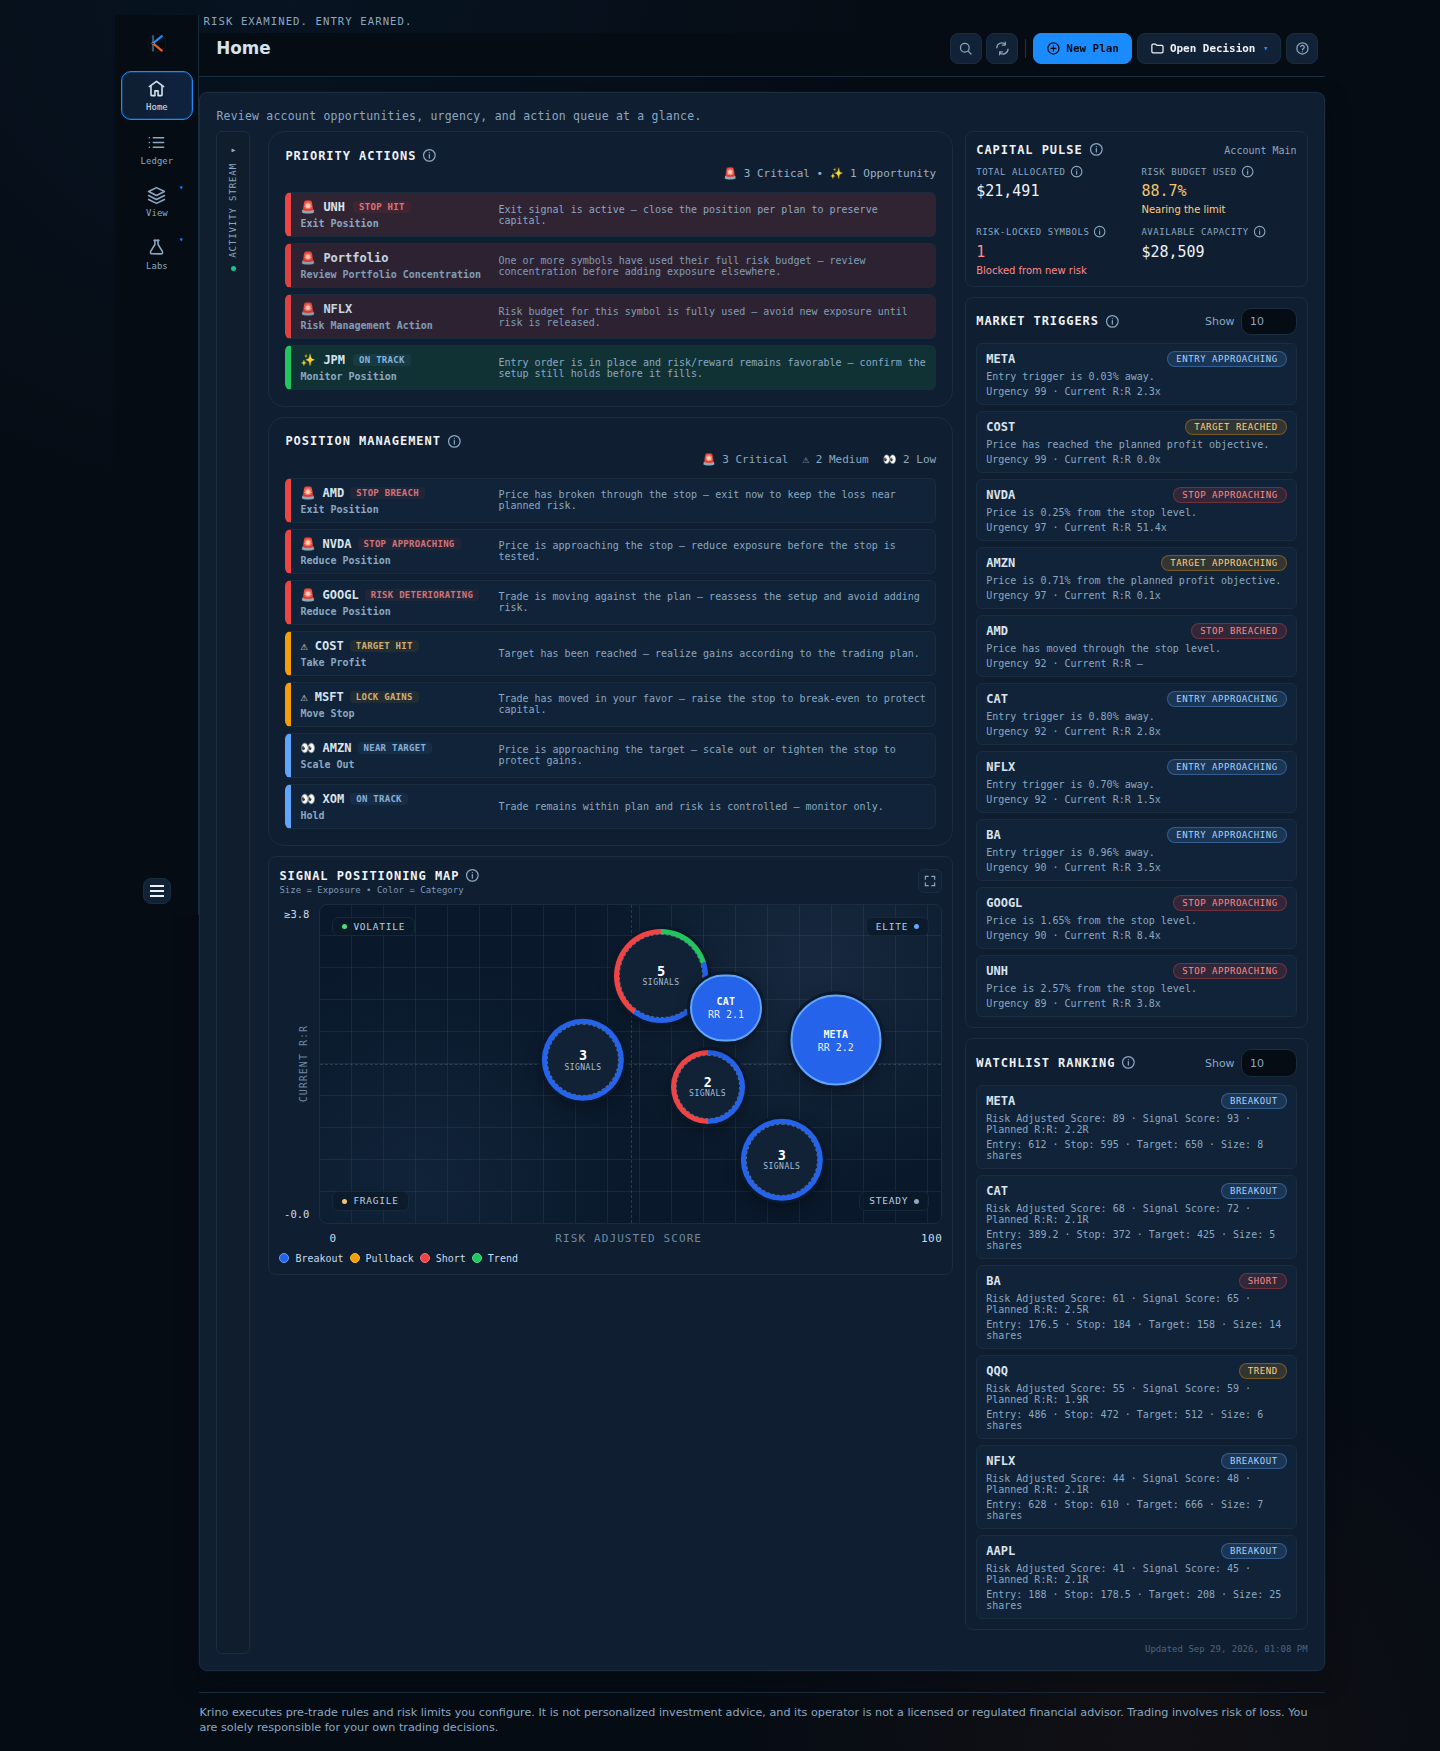
- Situation: a book with several breakout longs, a short, a trend ETF and a few clustered signals. Horizontal axis is the risk-adjusted score (0 to 100), vertical axis is current reward-to-risk.
- Reading: the largest bubbles sit toward the right (high score), which is where size should be. One position (blue, high score, R:R above 2) is the leader. Bubbles labelled “3 signals” group several symbols that sit in the same spot, a sign they look alike on both axes.
- Decision: add nothing to the crowded blue cluster; look for pullback or trend setups (a different colour) to diversify the type of risk, not only the ticker.
Corner labels turn the chart into a checklist. Elite (high score, strong reward) is where you want size. Fragile (low score, thin reward) is where size is a mistake. Volatile (low score, high reward-to-risk) and Steady (high score, low reward-to-risk) mark the in-between corners: ideas that need a closer look before they get size.
Comparison: lists, sector heatmaps and position maps
| View | Shows | Misses |
|---|---|---|
| Position list | Size, P&L | Quality, clustering |
| Sector / market-cap heatmap | Industry and size concentration | Setup quality, remaining reward |
| Position map (score × reward-to-risk) | Quality, remaining reward, size, trade type | Sector labels (add them yourself) |
| Correlation matrix | Co-movement between names | Is hard to read at a glance |
Krino does not draw a sector grid. Its view is the position map, paired with Capital Pulse for how much of the risk budget is used.
Common mistakes
- Diversifying tickers, not risks. Five tech breakouts are one trade with five names.
- Letting size follow comfort. Big bubbles should sit in strong zones, not where you feel loyal.
- Reading maps without a risk number. Pair the picture with how much of the budget is used.
- Checking only on losing days. Concentration builds quietly while things are going well.
A framework you can use tomorrow
- Open the map once a day, before you look for new trades.
- Find the biggest bubble. Is it in a strong zone?
- Find any cluster. Would one bad day hit all of it?
- Check the colour mix. Are all positions the same type of trade?
- Compare with the risk budget used. A balanced map with a nearly exhausted budget still means you stop adding.
How Krino helps
The Signal Positioning Map on Krino’s Home screen plots each decision by risk-adjusted score and current reward-to-risk, sizes it by exposure and colours it by setup type (breakout, pullback, short, trend). Symbols that sit close together are grouped into a single “N signals” bubble, and you can maximise the chart to inspect it.
Next to it, Capital Pulse shows total allocated capital, the share of the risk budget used and the number of locked symbols, so the picture and the budget are read together.
Spot the cluster before it costs you.
The demo home screen has the Signal Positioning Map with a sample portfolio on it. No signup, no email, no card.
Quick start checklist
- Look at your book as a picture, not only a table, once a day.
- Flag any large position in a weak-score or thin-reward area.
- Count clusters: how many positions would move together?
- Diversify trade type as well as ticker.
- Read the map next to your risk budget used.
- Decide before the market opens what you will trim or not add to.
The question that actually matters
Instead of asking “how many positions do I have?” ask “how many independent bets do I really have?” Map your book tonight and count the clusters.
Check your concentration before the next buy.
See a sample portfolio mapped in the demo. No signup needed.
Krino executes rules and risk limits you configure. It is not personalized investment advice. Trading involves risk of loss. You are solely responsible for your own trading decisions. The worked examples in this article use illustrative prices and demo data, not a recommendation or real market data.