Building a risk-first portfolio: budget the loss before the buy.
Most portfolios are built from the top down: pick winners, then hope the risk works out. A risk-first portfolio starts from the loss you can accept and lets every position earn its share of it.
A typical portfolio is a list of things the trader likes. A risk-first portfolio is a budget, with each position using part of it.
The difference changes what you do when the tenth idea shows up, when a winner tempts you to add, and when markets turn against you all at once.
The problem: risk is the leftover
In a top-down portfolio you decide what to buy and how much feels right, and risk is whatever results. Five positions at 1% each put 5% at stake, though you never decided you were willing to lose 5%.
In calm markets nobody notices. When correlations jump, five “independent” positions move as one, and no single trade’s risk number predicted the hit.
Key concept: one budget, three caps
| Account budget | The most you will lose if every open stop is hit |
| Symbol cap | The most any single name may contribute, adds included |
| Per-trade risk | What one new idea may take from the rest |
Every position is then sized from its stop: shares = risk amount / (entry − stop). The budget is what is spent, not what is hoped for.
Your portfolio is its open risk, not its open positions. Count the first one before you add to the second.
Worked example: an add that just fits
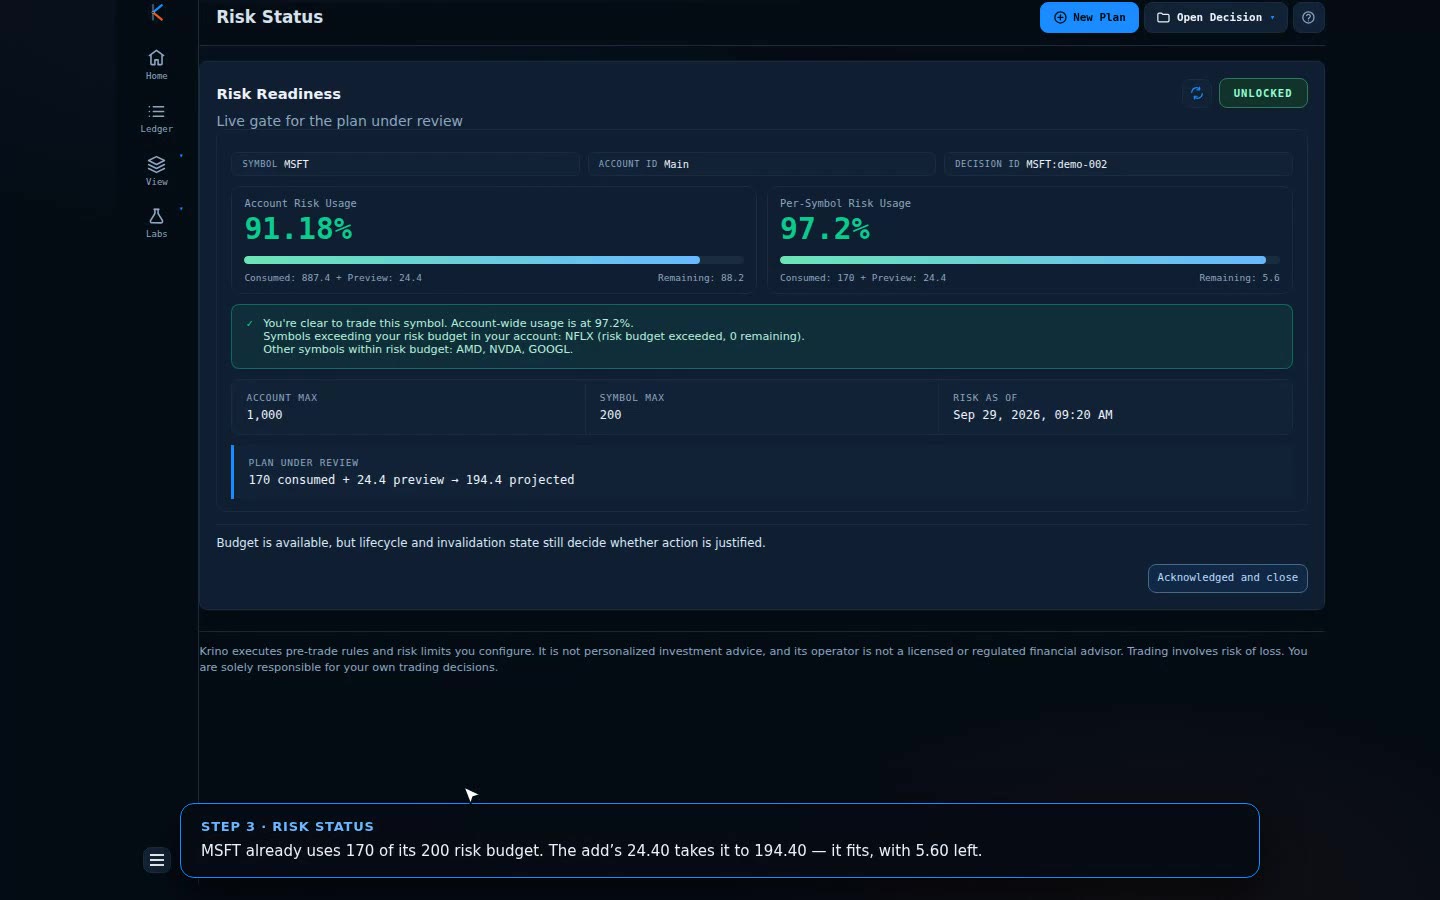
- Situation: MSFT is up. The plan is to add 2 shares at 438.20 with a stop at 426 and a target of 470. Account budget 1,000, symbol cap 200.
- The check: MSFT already uses 170 of its 200 budget. The add risks 24.40 (2 × 12.20), taking it to 194.40 with 5.60 to spare.
- The near miss: a 5-share add would have risked 61.00, taking the symbol to 231, over its cap.
- Outcome: the smaller add proceeds as its own decision; the larger one is never placed, with no internal argument.
Comparison: top-down vs risk-first
| Top-down | Risk-first | |
|---|---|---|
| Starting point | Ideas I like | Loss I can accept |
| Position size | What feels right | Budget / stop distance |
| The tenth idea | Added | Added only if the budget has room |
| Adding to winners | By conviction | As a new decision with its own risk |
| When it goes wrong | Surprise | Bounded by design |
Common mistakes
- Measuring risk per trade only. What counts is the sum across open positions.
- Moving stops to free budget. It lowers the number and raises the real risk.
- Treating an add as the same trade. It has a new entry and a new stop. Size it from those.
- Diversifying names instead of risks. Look at clusters, not tickers.
- Overriding the cap when “this one is special”. That sentence is the one the cap is for.
A framework you can use tomorrow
- Pick the account budget: the loss you can take in a bad week without changing your behaviour.
- Set a symbol cap, often 15–25% of the account budget.
- Size each new plan from its stop, within the symbol cap and what the account has left.
- Treat adds as new plans, and check the symbol’s total after the add.
- When the account budget is used, stop adding. Wait for open plans to complete or be cancelled.
How Krino helps
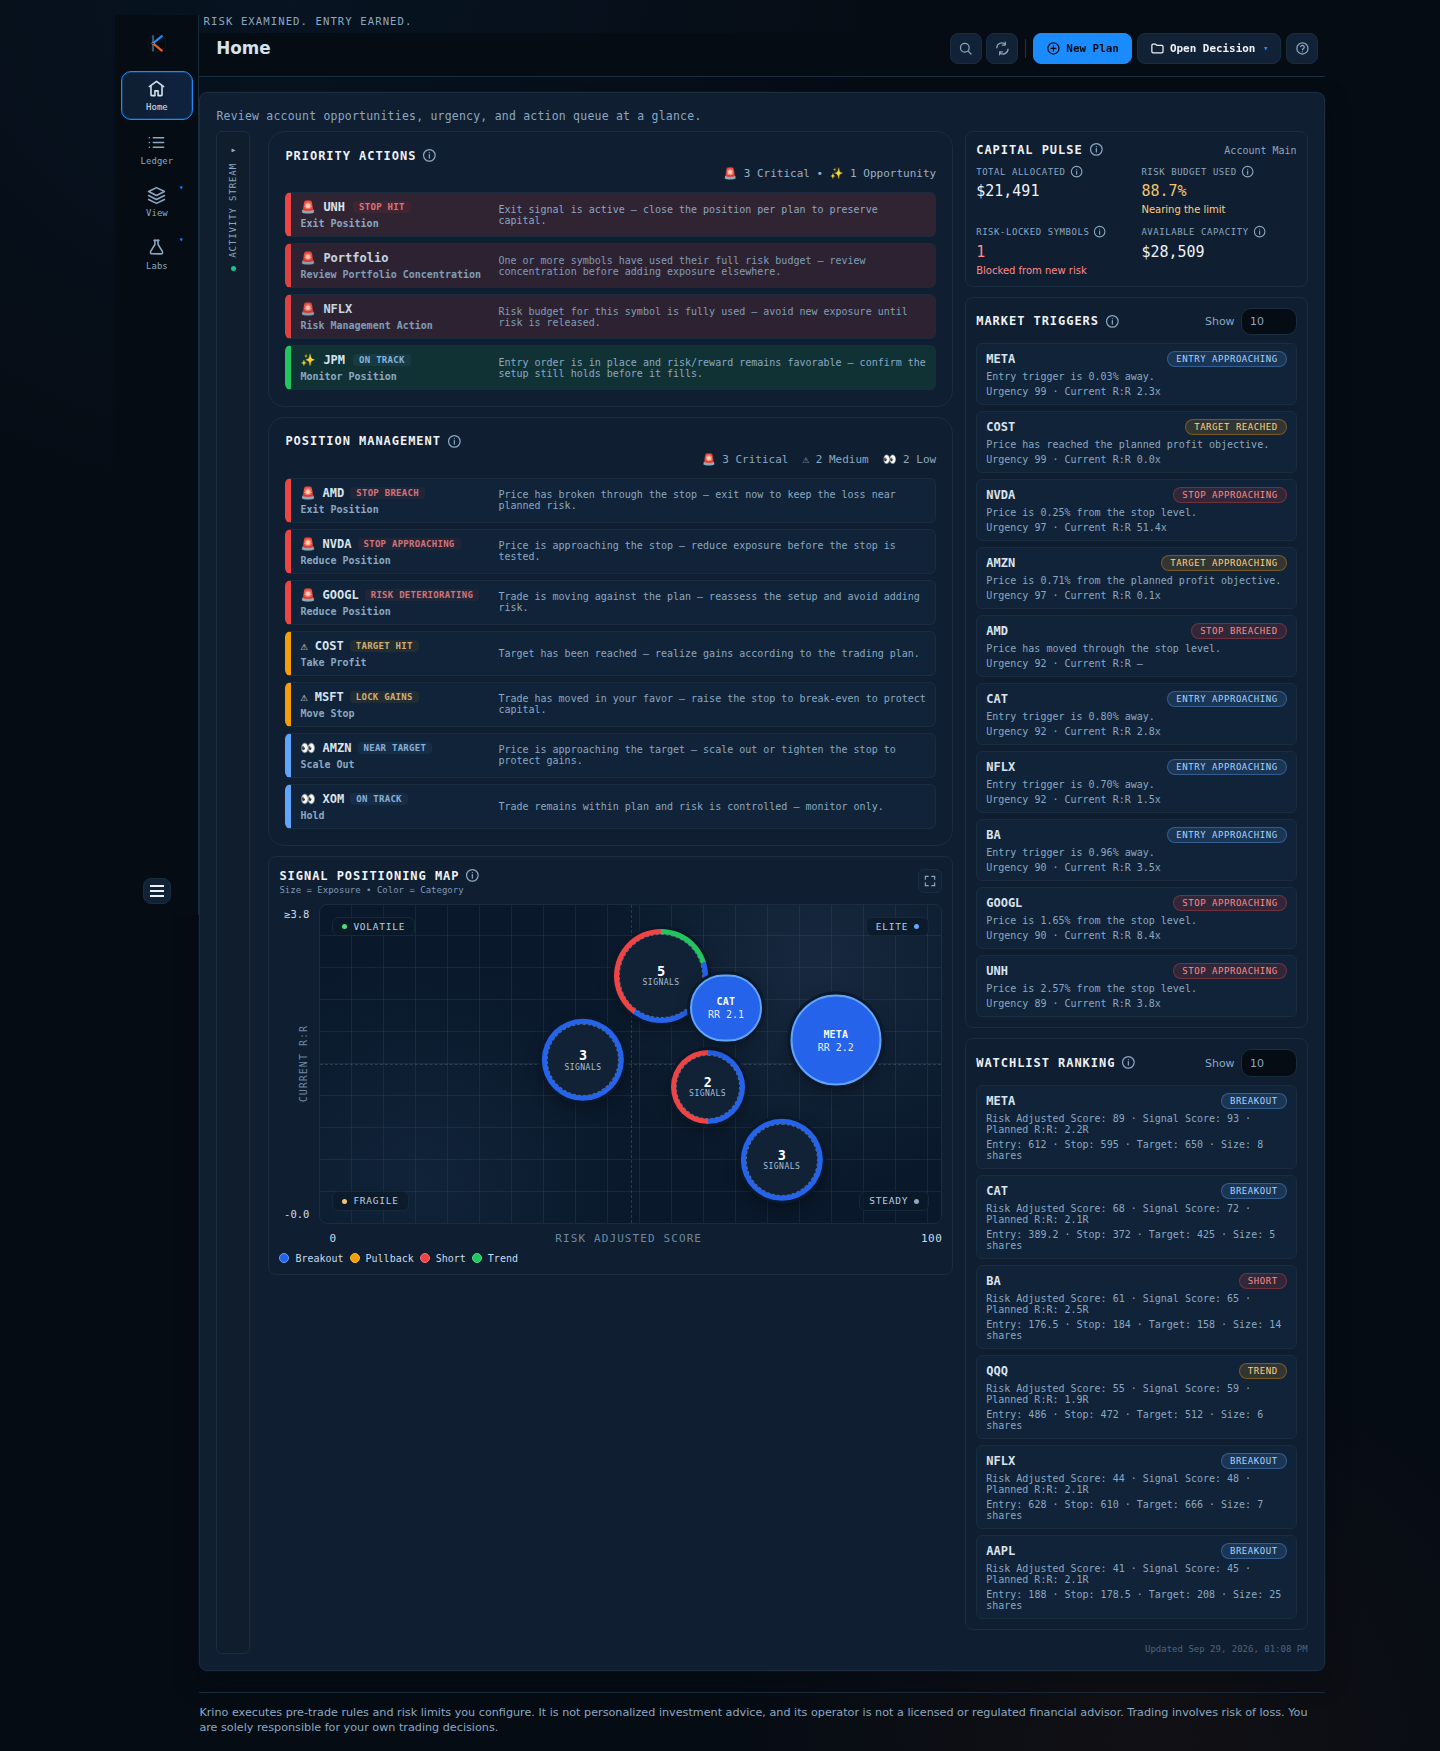
Krino checks each plan against both the account budget and the per-symbol cap before it can be accepted, showing consumed risk, the plan’s preview and what remains. Capital Pulse on Home shows the share of the budget used, and a locked symbol or account stops new entries.
Risk is freed when the plans holding it are completed, rejected or cancelled, so the budget stays tied to real positions, not a calendar. The Signal Positioning Map adds a view of where the exposure sits, by quality and reward-to-risk.
How much room does your risk budget leave?
See a risk budget say no.
The demo opens Risk Status for NFLX, whose risk budget is used up, so new plans are blocked. No signup, no email, no card.
Quick start checklist
- Write the account budget as a currency amount.
- Set a symbol cap and keep adds inside it.
- Compute shares from the stop, not from comfort.
- Check total open risk before every new order.
- Stop adding when the account budget is used.
- Look at clusters, not just ticker count.
The question that actually matters
Instead of asking “what should I buy next?” ask “how much of my loss budget is already spoken for?” Add up your open risk tonight. It is the most honest number about your portfolio.
Budget the loss before your next buy.
Set your caps once and let them gate every plan. Try it on sample trades, no signup needed.
Krino executes rules and risk limits you configure. It is not personalized investment advice. Trading involves risk of loss. You are solely responsible for your own trading decisions. The worked examples in this article use illustrative prices and demo data, not a recommendation or real market data.